


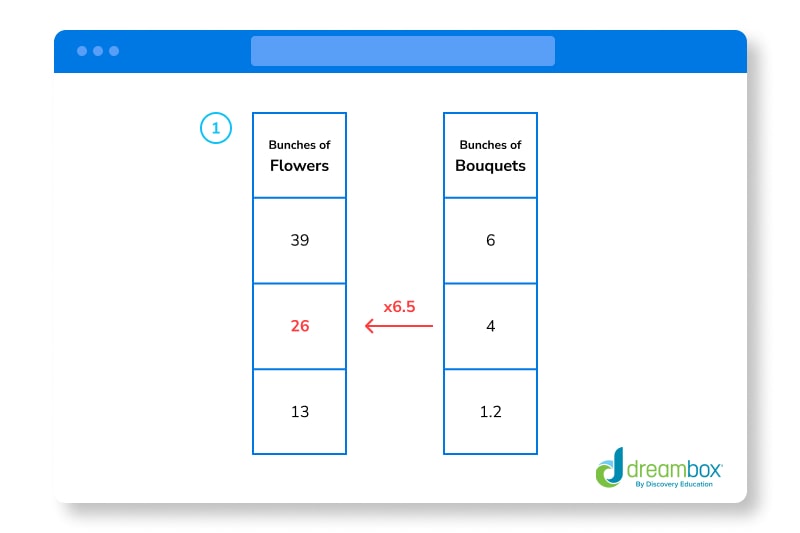
Q1. Nadine is a florist. She calculates that she uses 39 bunches of flowers for every 6 bouquets she makes. Fill in the missing number in the following ratio table.

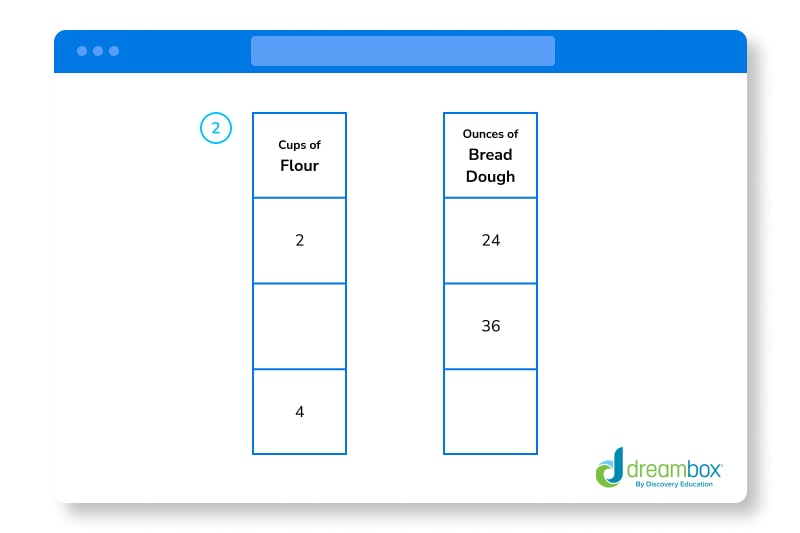
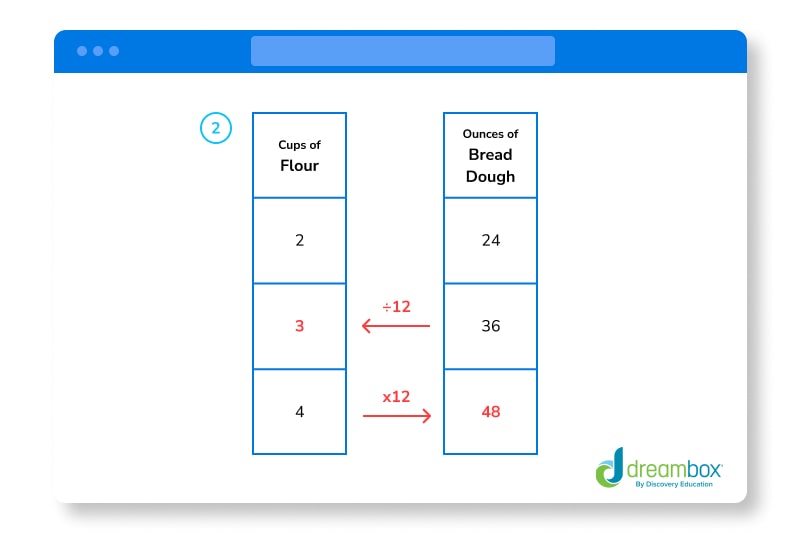
Q2. For every 24 ounces of bread dough you make, you use 2 cups of flour. Fill in the missing numbers in the following ratio table.
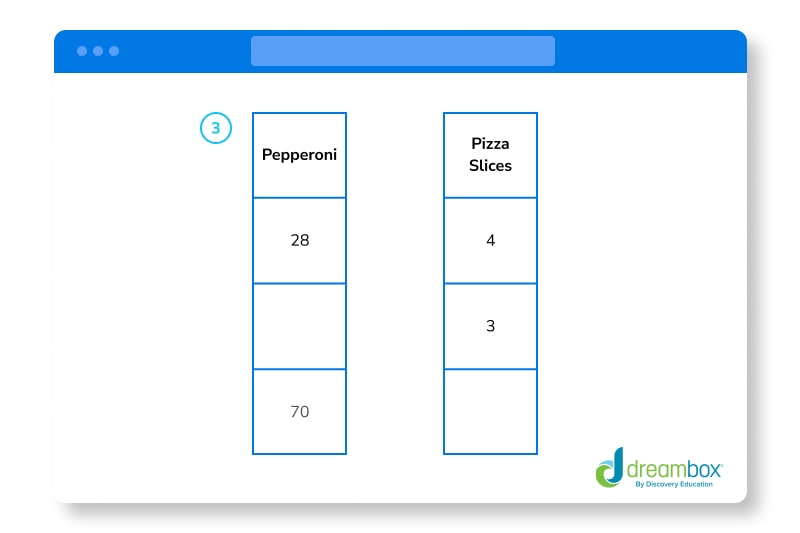
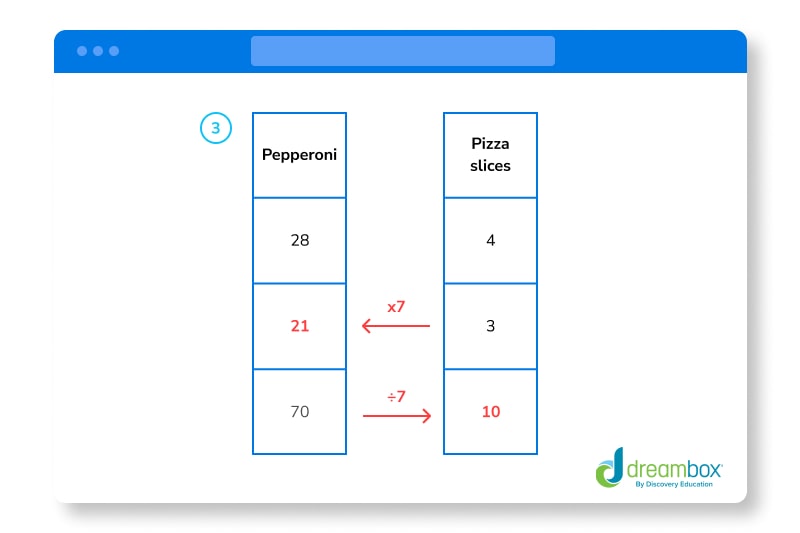
Q3. Kenny uses 28 pieces of pepperoni for every 4 slices of pizza he makes. Fill in the missing numbers in the following ratio table.
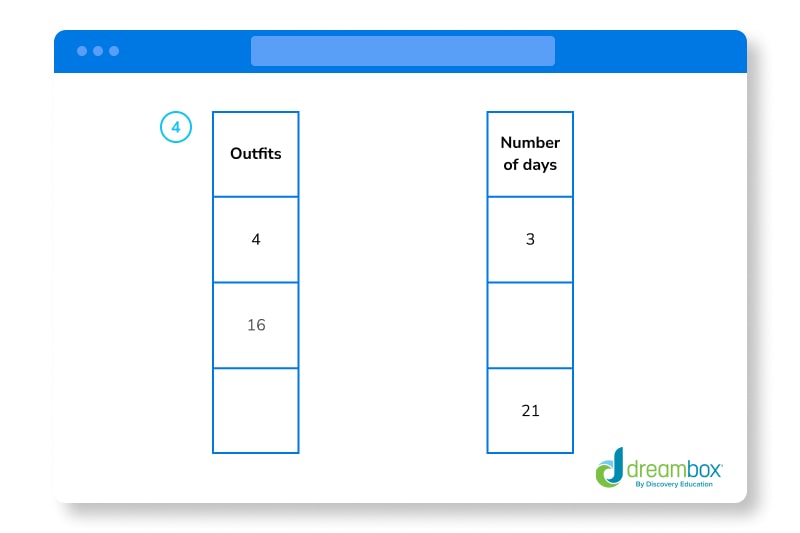
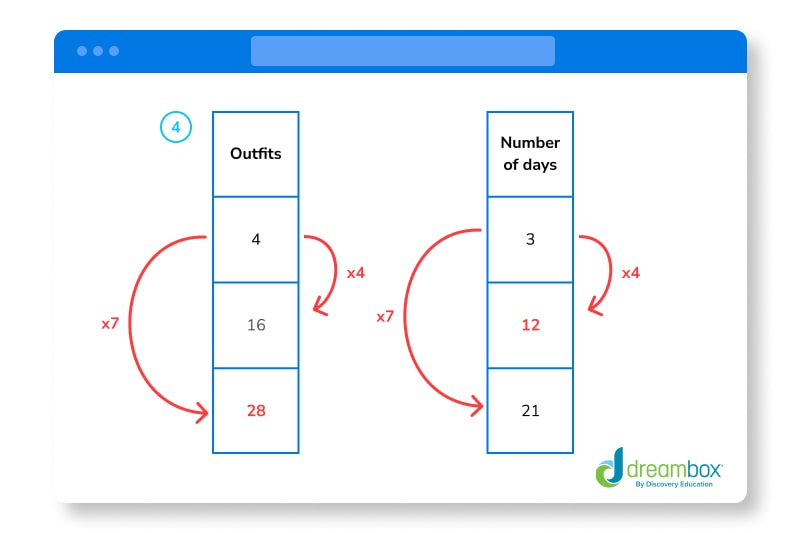
Q4. Maria loves fashion and likes to wear unique outfits. She usually wears 4 outfits within a time span of 3 days. Fill in the missing numbers in the following ratio table.
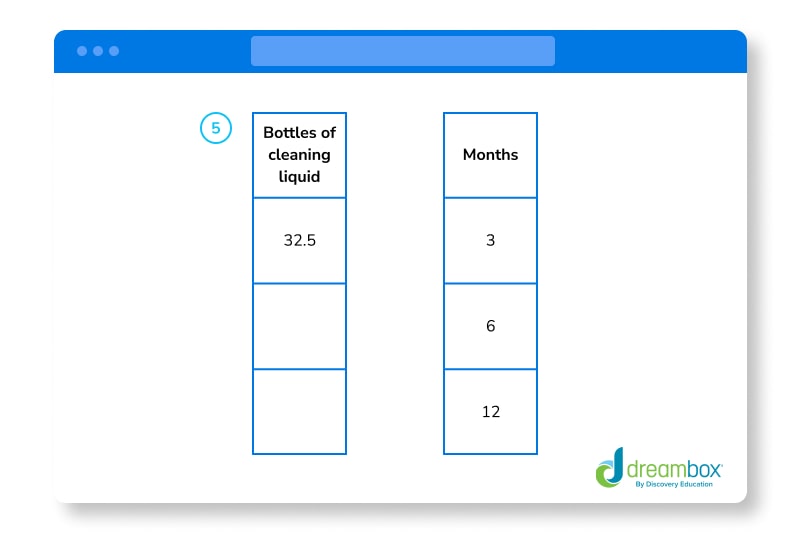
Q5. A middle school janitor uses up 32.5 bottles of cleaning liquid every 3 months to clean the school. Fill in the ratio table to determine how many bottles of cleaning liquid the janitor will have to use in 6 months and 12 months.